Mastering Divergence Trading with the MACD Strategy Explained
Written on
Chapter 1: Introduction to MACD Trading
In a prior article, we explored the Moving Average Crossover Strategy, which introduced various techniques utilized in Quantitative Analysis. This post delves into a more intricate method known as the Moving Average Convergence Divergence (MACD) strategy, implemented in Python.

Photo by Nick Chong on Unsplash
Getting Started
Installing Required Libraries
Before we start, ensure you have the necessary libraries installed. We'll be utilizing pandas for data manipulation, yfinance for retrieving historical stock data, and matplotlib for data visualization:
import pandas as pd
import yfinance as yf
import matplotlib.pyplot as plt
import numpy as np
Fetching Historical Stock Data
Define a function to acquire historical stock data using the yfinance library:
def get_stock_data(symbol, start_date, end_date):
stock_data = yf.download(symbol, start=start_date, end=end_date)
return stock_data
Chapter 2: Understanding the MACD Strategy
This strategy generates buy and sell signals based on the convergence and divergence of two Exponential Moving Averages (EMAs). The essential components of this approach include:
- Short-term EMA (Fast Line): Typically a 12-period EMA.
- Long-term EMA (Slow Line): Generally a 26-period EMA.
- Signal Line: A 9-period EMA of the MACD line, calculated as the difference between the short-term and long-term EMAs.
Calculating the MACD Line:
- MACD = 12-Period EMA — 26-Period EMA
Calculating the Signal Line:
- Signal = 9-period EMA of MACD
Generating Buy and Sell Signals:
- Buy Signal: Occurs when the MACD line crosses above the Signal line, indicating a potential bullish market.
- Sell Signal: Happens when the MACD line crosses below the Signal line, suggesting a bearish market.
Divergence Confirmation:
Traders often look for divergence between the MACD and the price chart, which may indicate potential trend reversals.
def moving_average_convergence_divergence(data):
print(type(data), dir(data), 'n') # Debugging purposes
short_ema = data['Close'].ewm(span=12, adjust=False).mean()
long_ema = data['Close'].ewm(span=26, adjust=False).mean()
macd = short_ema - long_ema
signal = macd.ewm(span=9, adjust=False).mean()
return macd, signal
Setting Up the Data
Using the previously created get_stock_data function, we will apply it to our strategy. For this example, we will focus on Apple Inc. (AAPL) from 2020 to 2021. Feel free to adjust the dates as needed:
symbol = 'AAPL'
start_date = '2020-01-01'
end_date = '2021-01-01'
data = get_stock_data(symbol, start_date, end_date)
data['MACD'], data['Signal'] = moving_average_convergence_divergence(data)
# Generate Buy/Sell signals
data['Buy_Signal'] = (data['MACD'] > data['Signal']) & (data['MACD'].shift(1) <= data['Signal'].shift(1))
data['Sell_Signal'] = (data['MACD'] < data['Signal']) & (data['MACD'].shift(1) >= data['Signal'].shift(1))
Visualizing the Strategy
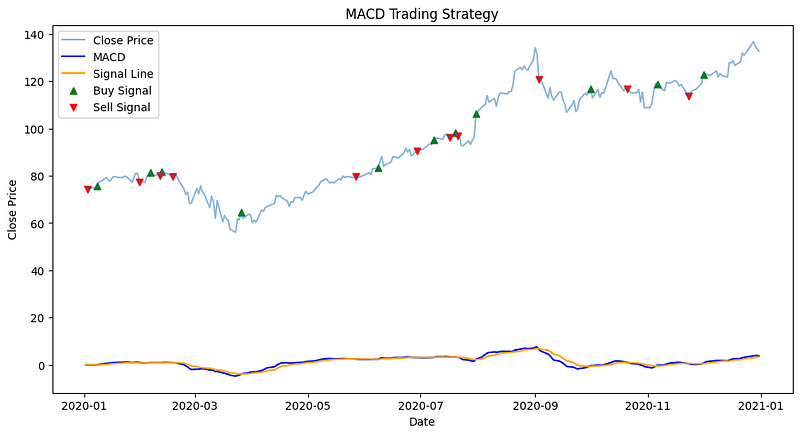
Now, let's visualize the strategy, including both the buy and sell signals.
plt.figure(figsize=(12, 6))
plt.plot(data['Close'], label='Close Price', alpha=0.5)
plt.plot(data['MACD'], label='MACD', color='blue')
plt.plot(data['Signal'], label='Signal Line', color='orange')
# Highlight Buy signals
plt.scatter(data.index[data['Buy_Signal']], data['Close'][data['Buy_Signal']], label='Buy Signal', marker='^', color='green')
# Highlight Sell signals
plt.scatter(data.index[data['Sell_Signal']], data['Close'][data['Sell_Signal']], label='Sell Signal', marker='v', color='red')
plt.title('MACD Trading Strategy')
plt.xlabel('Date')
plt.ylabel('Close Price')
plt.legend()
plt.show()

The signals appear as the MACD (in dark blue) intersects with the Signal line (in orange).
Chapter 3: Conclusion
In this article, we introduced the Moving Average Convergence Divergence Strategy. Similar to the Moving Average Crossover Strategy, this method is not intended for live trading without thorough backtesting, validation, and refinement. In the next post, we will explore the Bollinger Bands and RSI strategy. Please share your thoughts; I’d love to hear your feedback!
Video Description: Improve Your Trading with the MACD indicator, explaining how to utilize this powerful tool effectively.
Video Description: A must-watch on the MACD Divergence Trading Strategy, offering insights and practical applications.