Insights into Global Tech Layoffs: A Deep Dive with Power BI
Written on
Chapter 1: Overview of Global Tech Layoffs
The tech sector, a hub of innovation, is currently facing significant challenges. As we observe the fluctuations within this industry, it's essential to understand the intricate dynamics behind global layoffs. By leveraging the advanced features of Power BI, we can gain valuable insights into the trends and factors that shape this unpredictable environment.
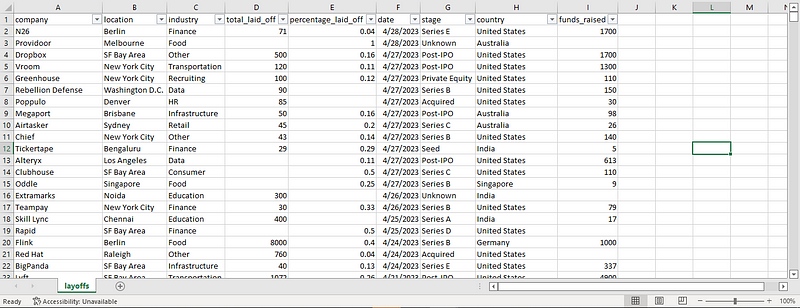
During my investigation, I utilized a dataset sourced from Kaggle, encompassing the period from the onset of the COVID-19 pandemic to April 28, 2023. This dataset features information on 448,447 employees laid off from 2,010 companies across 62 nations and 30 distinct tech sectors. My aim was to analyze this data thoroughly to identify key players, explore underlying causes, and pinpoint the sectors most affected by these changes. This analysis not only sheds light on critical insights but also highlights strategies and trends that can influence tech career paths in this rapidly evolving landscape.

Data Preparation and Cleaning
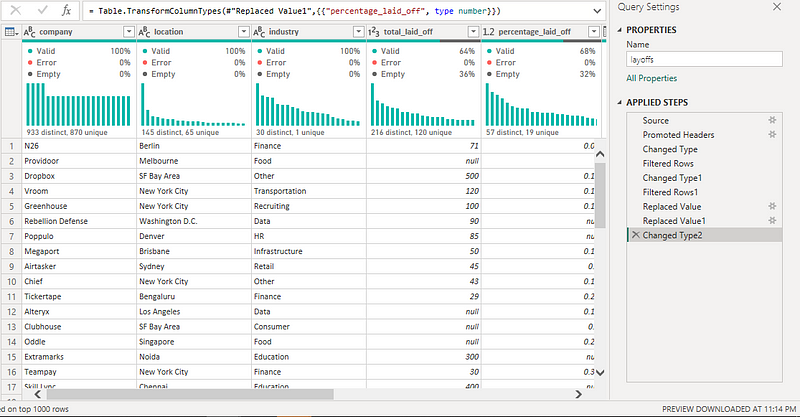
To kick off the data cleaning process, I imported the dataset into Power BI, utilizing the powerful Power Query Editor. Power BI automatically recognized and designated the first row as headers, setting the stage for effective data cleaning.
I carefully adjusted data types to ensure accuracy by defining text, dates, and integers appropriately. A thorough examination for duplicate entries was conducted to uphold data integrity. Furthermore, I combed through the dataset for any null or blank values, replacing inconsistencies with the term "unknown" to maintain completeness.
With the dataset refined and optimized, Power BI became a powerful instrument for storytelling through data. The stage was set to unveil profound insights, guiding informed decisions and impactful outcomes.
Data Analysis Techniques
Once the dataset was cleaned and prepared, I utilized Power BI to extract meaningful findings. I addressed several key questions to illuminate the complex dynamics surrounding global tech layoffs. For those interested in a more detailed analysis, I encourage you to explore the interactive Power BI report.
To streamline the analytical process, I created a table titled “MyMeasures” to house significant calculations. This table allowed for easier management of key metrics.
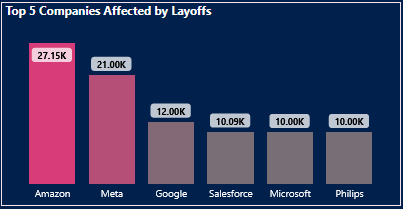
- Identifying the Top 5 Companies Impacted by Layoffs: This analysis reveals the companies experiencing the most substantial workforce reductions, offering insights into the effects on employees and the broader corporate landscape. By calculating the total number of layoffs per company, we can gauge the scale of workforce reductions.

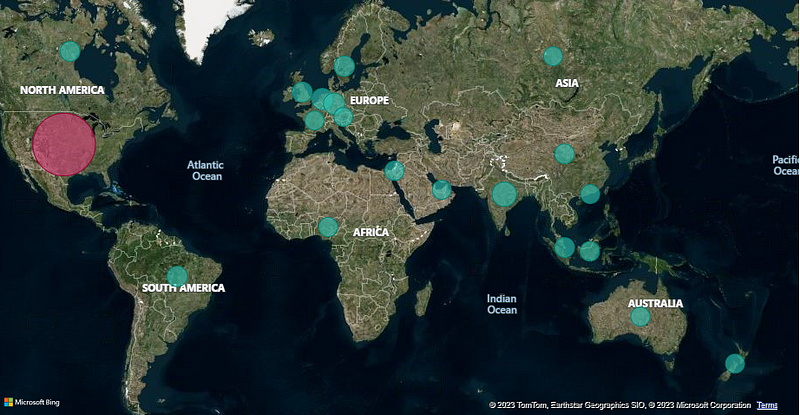
- Analyzing the Top 20 Countries with the Highest Layoff Rates: This perspective helps us understand which regions are most severely affected by tech layoffs. Utilizing Power BI's mapping capabilities, I filtered the data to display only the top 20 countries with the most layoffs.
- Examining Layoff Trends Over Time: This analysis allows us to explore historical and projected trends in layoffs, identifying patterns and fluctuations that could signal future workforce challenges. By integrating time-based data, we can visualize these trends effectively.
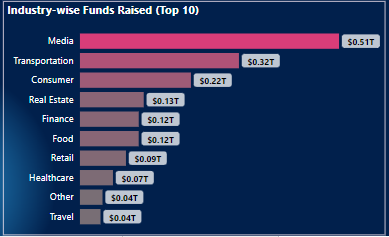
- Highlighting the Top 10 Industries by Funds Raised: This section investigates which industries have attracted the most investment, indicating potential growth areas. By transforming initial funding estimates into actual values, I visualized funding distributions across industries.

- Discovering Leading Industries Affected by Layoffs: This analysis identifies sectors experiencing the most job cuts, providing insights into the trends and factors shaping these industries.
Through this analytical journey, I aimed to offer a nuanced understanding of the landscape of global tech layoffs.
Crafting a Compelling Report
To design an engaging report, I selected a suitable background using Canva and explored various themes on Coolors to enhance the visual appeal of my visualizations. These tools helped me create a report that effectively communicates complex information in a captivating way.
I invite you to access the interactive dashboard here for a deeper dive into the insights and comprehensive analysis of the global tech layoffs landscape.
Conclusion and Next Steps
In summary, this extensive examination of global tech layoffs has unveiled critical insights into the trends, patterns, and influencing factors within this dynamic sector. Our analysis highlights how companies like Amazon, Meta, and Google are significantly affected. The year 2023 shows an alarming increase in layoffs, underscoring a persistent trend.
Furthermore, the data indicates that the United States leads in layoffs, with the consumer and retail industries facing substantial impacts. Companies in the post-IPO phase are particularly vulnerable to job cuts, while sectors like media, transportation, and consumer goods have garnered significant funding during this time.
These findings serve as essential resources for anyone navigating the tech job market and seeking to understand the factors driving layoffs. As the tech industry continues to evolve, it’s vital for job seekers to stay informed about emerging trends, adapt their skills, and explore stable growth opportunities.
By harnessing Power BI and data visualization, I have uncovered actionable insights that can influence career decisions and foster a comprehensive understanding of the global tech layoffs landscape.
Let us navigate the complexities of tech layoffs and embrace the opportunities that lie ahead together.
Thank you for engaging with this content! If you found the insights valuable, please give it a thumbs up 👍, leave your thoughts in the comments 💬, and share it with your network 🔗. Your support helps spread awareness!
For collaborations or inquiries, feel free to reach out at [email protected]. I welcome new opportunities and connections!
Stay tuned for more enlightening content as we explore the ever-evolving landscape of tech layoffs. Remember, the future is ours to shape! 🌟
Video Description: Dive into the ongoing tech sector layoffs of 2024, exploring the latest news and trends impacting the industry.
Video Description: Discover the alarming statistics behind layoffs in 2024, where 422 tech companies have laid off over 136,000 workers.