Creating Training ROI KPI in Power BI: A Step-by-Step Guide
Written on
Chapter 1: Introduction to Power BI and KPIs
Power BI serves as a robust platform that enables connections to diverse data sources, allowing users to transform, model, and generate engaging dashboards and reports. This tool is invaluable for extracting insights from data and effectively conveying them.
What Exactly is a KPI?
A KPI, or Key Performance Indicator, is a quantifiable measure that reflects how well an individual or organization is achieving its objectives. These indicators can be financial—like net profit or revenue—or non-financial, such as customer satisfaction or retention rates. KPIs are essential for tracking progress, recognizing strengths and weaknesses, and making data-driven decisions to enhance overall performance.

Understanding Training ROI
The ROI (Return on Investment) of training evaluates the financial gains derived from a training program in relation to its costs. This metric aids organizations in assessing the effectiveness and value of their training efforts by comparing performance improvements to the investments made.
How to Calculate Training ROI
The fundamental formula to determine training ROI is represented as follows:

For instance, if a company allocates $10,000 to a training program and subsequently increases its revenue by $15,000, the ROI would be computed as:

Reasons to Measure Training ROI
- Justify Training Expenses: Clearly demonstrates the value of training initiatives to stakeholders.
- Optimize Training Programs: Identifies which training sessions yield the highest effectiveness.
- Enhance Decision-Making: Informs future training investments by highlighting programs that deliver the best returns.
Chapter 2: Building the ROI KPI Card
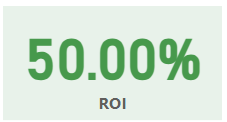
In this chapter, we will create a KPI card that showcases the ROI of training.
Calculating ROI
To compute the ROI, we must find the average percentage of revenue generated from the benefits of training after deducting the training costs.
DAX for Training ROI:
The formula to calculate ROI is:
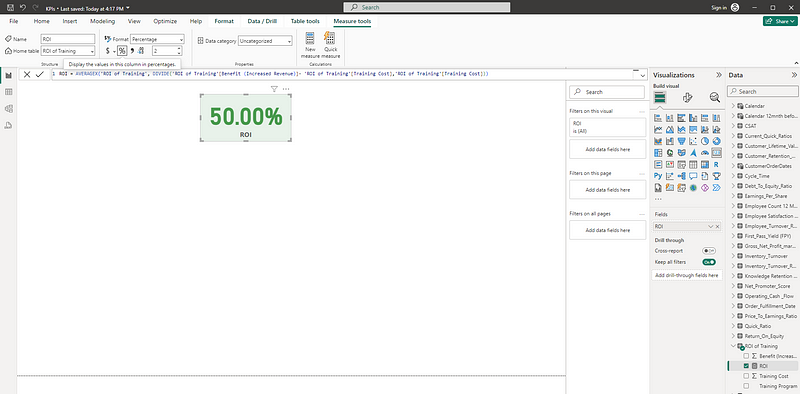
ROI = AVERAGEX(‘ROI of Training’, DIVIDE(‘ROI of Training’[Benefit (Increased Revenue)] - ‘ROI of Training’[Training Cost], ‘ROI of Training’[Training Cost]))

The AVERAGEX function is utilized here to compute the average ROI across all employees, as opposed to the AVERAGE function, which focuses on a single individual.
The AVERAGEX function accepts two parameters—Table and Expression. For our Table, we will reference "ROI of Training," our primary dataset. The Expression will employ the DIVIDE function, where the Numerator is the difference between the training benefits and costs, and the Denominator is the training cost itself.
Note: While it's possible for revenue to decrease post-training, this analysis does not cover such instances.
To delve deeper into the DIVIDE function, refer to this link.

This table can be manually calculated to verify the results obtained from the aforementioned DAX formula displayed in the KPI.
Creating the KPI Card:
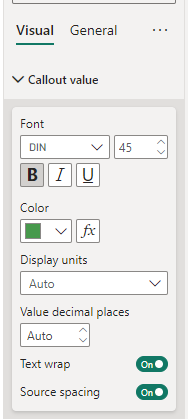
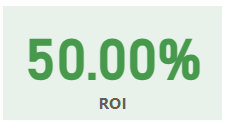
Begin by selecting a card visual from the Visualizations pane and assign the ROI calculation to it. In the Format section of Visualizations, navigate to Callout value, expand the options, select a color (e.g., Hex code #47994C), and bold the font.
Next, under the Category label in Visual, expand it, choose a color (e.g., Hex code #605E5C), and bold the font.

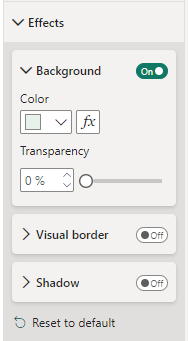
Proceed to General, expand Effects, and select a Background color (e.g., Hex code #E8F2EA).
With the KPI card selected, choose the ROI measure from Data, and an option for Measure tools will appear. Click on the % icon to display the percentage and set the decimal points to two.
In conclusion, this process culminates in the creation of our KPI card.
For additional KPIs such as Knowledge Retention Rate, Training Completion Rate, and others, refer to the provided links.
For further insights, follow along with this link and subscribe to the Power BI Publication and Newsletter, as well as join our Power BI community.
References: